2
gas resources. Many of the heavy mineral sandstone depos-
its were discovered in the 1950s by airborne radiometric
surveys for uranium, as the deposits are radioactive due to
elevated uranium and thorium found within monazite and
zircon, primarily. Previous studies by McLemore (2010,
2016, 2017) have examined numerous heavy mineral
sandstones in the San Juan Basin of New Mexico, compil-
ing historic data, as well as collecting new data including
petrography and geochemical analyses. The New Mexico
Bureau of Geology and Mineral Resources is currently rein-
vestigating heavy mineral sandstones in the state as part
of the U.S. DOE CORE-CM (Carbon Ore, Rare Earth
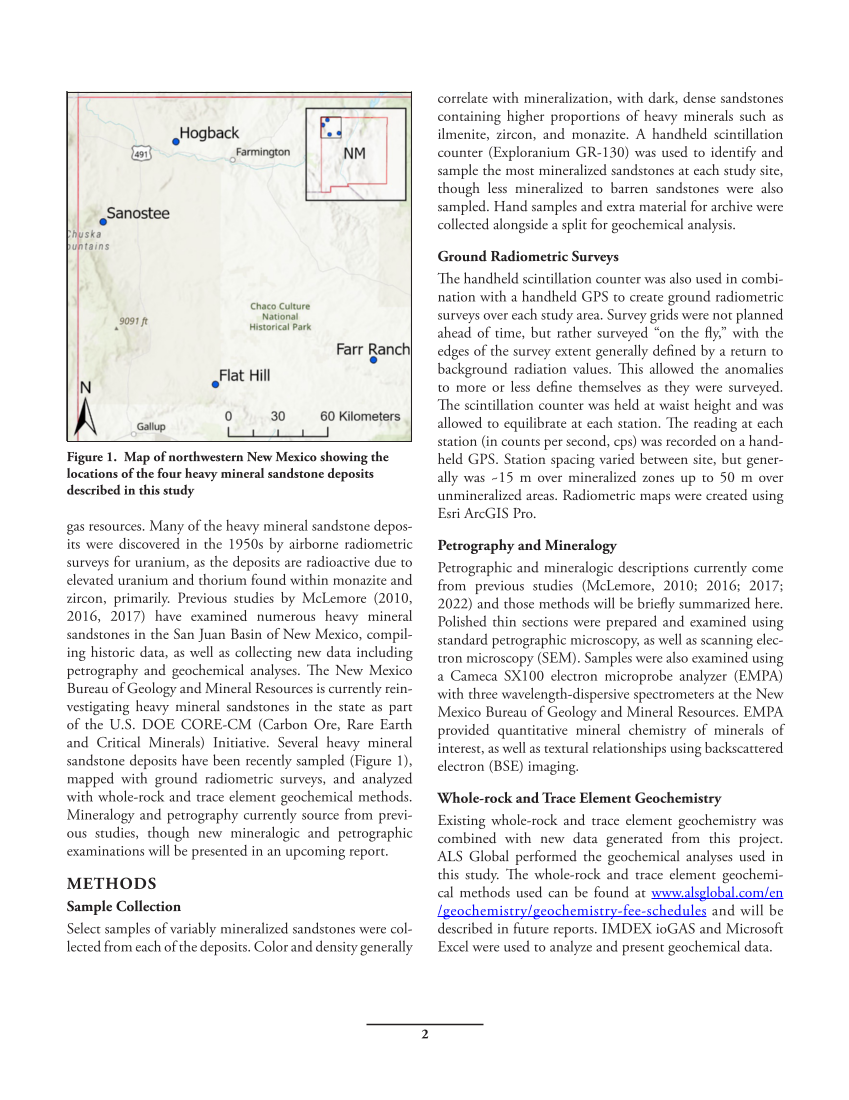
and Critical Minerals) Initiative. Several heavy mineral
sandstone deposits have been recently sampled (Figure 1),
mapped with ground radiometric surveys, and analyzed
with whole-rock and trace element geochemical methods.
Mineralogy and petrography currently source from previ-
ous studies, though new mineralogic and petrographic
examinations will be presented in an upcoming report.
METHODS
Sample Collection
Select samples of variably mineralized sandstones were col-
lected from each of the deposits. Color and density generally
correlate with mineralization, with dark, dense sandstones
containing higher proportions of heavy minerals such as
ilmenite, zircon, and monazite. A handheld scintillation
counter (Exploranium GR-130) was used to identify and
sample the most mineralized sandstones at each study site,
though less mineralized to barren sandstones were also
sampled. Hand samples and extra material for archive were
collected alongside a split for geochemical analysis.
Ground Radiometric Surveys
The handheld scintillation counter was also used in combi-
nation with a handheld GPS to create ground radiometric
surveys over each study area. Survey grids were not planned
ahead of time, but rather surveyed “on the fly,” with the
edges of the survey extent generally defined by a return to
background radiation values. This allowed the anomalies
to more or less define themselves as they were surveyed.
The scintillation counter was held at waist height and was
allowed to equilibrate at each station. The reading at each
station (in counts per second, cps) was recorded on a hand-
held GPS. Station spacing varied between site, but gener-
ally was ~15 m over mineralized zones up to 50 m over
unmineralized areas. Radiometric maps were created using
Esri ArcGIS Pro.
Petrography and Mineralogy
Petrographic and mineralogic descriptions currently come
from previous studies (McLemore, 2010 2016 2017
2022) and those methods will be briefly summarized here.
Polished thin sections were prepared and examined using
standard petrographic microscopy, as well as scanning elec-
tron microscopy (SEM). Samples were also examined using
a Cameca SX100 electron microprobe analyzer (EMPA)
with three wavelength-dispersive spectrometers at the New
Mexico Bureau of Geology and Mineral Resources. EMPA
provided quantitative mineral chemistry of minerals of
interest, as well as textural relationships using backscattered
electron (BSE) imaging.
Whole-rock and Trace Element Geochemistry
Existing whole-rock and trace element geochemistry was
combined with new data generated from this project.
ALS Global performed the geochemical analyses used in
this study. The whole-rock and trace element geochemi-
cal methods used can be found at www.alsglobal.com/en
/geochemistry/geochemistry-fee-schedules and will be
described in future reports. IMDEX ioGAS and Microsoft
Excel were used to analyze and present geochemical data.
Figure 1. Map of northwestern New Mexico showing the
locations of the four heavy mineral sandstone deposits
described in this study
gas resources. Many of the heavy mineral sandstone depos-
its were discovered in the 1950s by airborne radiometric
surveys for uranium, as the deposits are radioactive due to
elevated uranium and thorium found within monazite and
zircon, primarily. Previous studies by McLemore (2010,
2016, 2017) have examined numerous heavy mineral
sandstones in the San Juan Basin of New Mexico, compil-
ing historic data, as well as collecting new data including
petrography and geochemical analyses. The New Mexico
Bureau of Geology and Mineral Resources is currently rein-
vestigating heavy mineral sandstones in the state as part
of the U.S. DOE CORE-CM (Carbon Ore, Rare Earth
and Critical Minerals) Initiative. Several heavy mineral
sandstone deposits have been recently sampled (Figure 1),
mapped with ground radiometric surveys, and analyzed
with whole-rock and trace element geochemical methods.
Mineralogy and petrography currently source from previ-
ous studies, though new mineralogic and petrographic
examinations will be presented in an upcoming report.
METHODS
Sample Collection
Select samples of variably mineralized sandstones were col-
lected from each of the deposits. Color and density generally
correlate with mineralization, with dark, dense sandstones
containing higher proportions of heavy minerals such as
ilmenite, zircon, and monazite. A handheld scintillation
counter (Exploranium GR-130) was used to identify and
sample the most mineralized sandstones at each study site,
though less mineralized to barren sandstones were also
sampled. Hand samples and extra material for archive were
collected alongside a split for geochemical analysis.
Ground Radiometric Surveys
The handheld scintillation counter was also used in combi-
nation with a handheld GPS to create ground radiometric
surveys over each study area. Survey grids were not planned
ahead of time, but rather surveyed “on the fly,” with the
edges of the survey extent generally defined by a return to
background radiation values. This allowed the anomalies
to more or less define themselves as they were surveyed.
The scintillation counter was held at waist height and was
allowed to equilibrate at each station. The reading at each
station (in counts per second, cps) was recorded on a hand-
held GPS. Station spacing varied between site, but gener-
ally was ~15 m over mineralized zones up to 50 m over
unmineralized areas. Radiometric maps were created using
Esri ArcGIS Pro.
Petrography and Mineralogy
Petrographic and mineralogic descriptions currently come
from previous studies (McLemore, 2010 2016 2017
2022) and those methods will be briefly summarized here.
Polished thin sections were prepared and examined using
standard petrographic microscopy, as well as scanning elec-
tron microscopy (SEM). Samples were also examined using
a Cameca SX100 electron microprobe analyzer (EMPA)
with three wavelength-dispersive spectrometers at the New
Mexico Bureau of Geology and Mineral Resources. EMPA
provided quantitative mineral chemistry of minerals of
interest, as well as textural relationships using backscattered
electron (BSE) imaging.
Whole-rock and Trace Element Geochemistry
Existing whole-rock and trace element geochemistry was
combined with new data generated from this project.
ALS Global performed the geochemical analyses used in
this study. The whole-rock and trace element geochemi-
cal methods used can be found at www.alsglobal.com/en
/geochemistry/geochemistry-fee-schedules and will be
described in future reports. IMDEX ioGAS and Microsoft
Excel were used to analyze and present geochemical data.
Figure 1. Map of northwestern New Mexico showing the
locations of the four heavy mineral sandstone deposits
described in this study